

Making sense of the geek share market talk
Support and Resistance are two terminologies that are frequently used in market analysis and news. When the market or scrip starts moving in a positive territory, people talk about the probable levels of resistance where the northbound movement could pause or reversal of the upward trend occur. Inversely, as the market or scrip starts southbound movement, people start to look for support—a point or level where market decline could pause or reversal of the downward trend could ensue.
Stock traders/investors like to know of such support and resistance levels to set-up their trading/investing strategies. These levels/points on a chart help people make better decisions for profit booking at resistance levels and new accumulations at support levels.
Support is a price or index level in the chart where the price/index has higher probability of finding support as it falls. As the price starts to fall, buyers feel the scrip is getting cheaper. The temptation to buy increases. Buying interest continues to grow as the price gets further discounted. At a certain price level, demand gets concentrated and a support level is formed. The buying concentration exhausts the selling pressure and the price fall pauses.
As buying continues, supply starts to diminish. With less supply and more demand, the price will stabilize and help bounce off the price from this level. But if the price breaks through this level, buyers will pause to buy in anticipation of further discount while sellers will increase the supply in anticipation of stopping further loss. This will fuel further decline and this process will continue till a next level of support is not reached.
There are different technical methods of identifying support levels. A simple and commonly used method is to observe the historical price movement in the chart, and identify the points where the price has stabilized and bounced off from, on multiple occasions. The method entails identifying a level where the price got support at least two times in the past. If there is a history of finding support at the same level on multiple occasions, then such a level is considered a stronger support level. 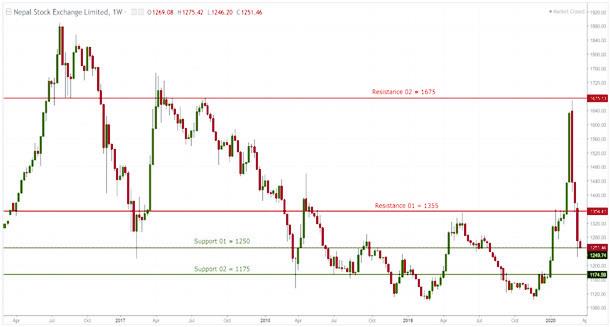
|
NEPSE Weekly Chart: Major Support and Resistance Levels |
Resistance is the opposite of support level. As the price of scrip increases, sellers start to feel the scrip is getting expensive and their profit margin is getting higher. Higher the price increase, higher will be the profit margin. With every increase in the price level, more and more sellers get tempted to sell and book profit. At a certain price level, all these supply gets concentrated and a resistance level is built. This is where the buying is exhausted, the price increase pauses and a reversal of the uptrend happens.
As with the support level, if the price breaks through this resistance level, the sellers will pause the supply with the anticipation of selling their scrip for more premium, while more and new buyers will come with the anticipation of profit to be made. This will help with further increment of price till a next level of support is met.
Resistance is identified as a price level where the price got resisted at least two times in the past. If it was resisted more than twice, the level can be considered a strong resistance. Any resistance, if breached, automatically converts into an immediate support. Similarly, if a support level is broken, it will start to work as the resistance in the future.

COVID-19 and the equity market in Nepal
Markets, by their nature, like certainty, guided as they are by the projections and probabilities based on historical data and events. Future results are estimated based on past ones and changing socio-economic realities. Their performance and the socio-economic environmental factors are monitored and adjusted in their projected year-end results on regular basis. This helps smoothen the effects of uncertainty to a large extent. Projected positive or negative results are reflected in stock charts through the scrip’s price movement.
But whenever there is a man-made or natural calamity, it creates greater uncertainty, which is not factored in future estimates. Markets are suddenly coerced into uncharted territories and experience a rude awakening. The surprise quickly turns into fear. The fear of the unknown. Immediate reaction is “fight or flight”—some will hold their ground and try to weather out the storm while others will give up and escape.
In the markets, the flight response is seen when people start to push the sell button. As more people go into flight response, panic sets in. Panic leads to further panic and the result is a bloodbath on the trading floor.
In December 2019, Chinese authorities identified a new Sars-like virus emerging and affecting people in the city of Wuhan in Hubei province. As this new virus, now named COVID-19, started to rapidly spread in the city, the authorities enforced complete lockdown of the affected area to slow the spread of the virus. The global market ignored the situation as a one-off that would soon be contained. The last trading day of 2019 ended on a positive note for major global markets including the stock exchanges of Shanghai and Hong Kong.
Year 2020 brought in more news of virus spread, deaths and quarantines. By mid-February, the virus had spread to South Korea, Japan and Iran. Now, the effect was seen in the South Korean and Japanese equity markets as they started to plunge. On February 27, all major US indices—the Dow Jones, S&P and the NASDAQ—went into a deep correction mode. The virus continued to move across the borders.
On March 11, the World Health Organization declared COVID-19 outbreak to be a pandemic. The announcement shocked all the major equity markets. Markets from South Korea to Indonesia to India to United States hit multiple circuit breakers as the fear took over. Even the multiple circuits were unable to stop the plunge in stock values, leading to the possibility of a global recession.
In Nepal, the secondary market had just had a bullish run when COVID-19 happened. The month of February saw a big bull run. It was further fuelled as the projected returns from the secondary market looked more attractive than the returns from other alternative investment avenues. Steep rise in the index from 1,100-ish to 1,600+ (a gain of 500 points) within a span of three months was begging for a correction. This correction was set in motion on the very first trading day of March.
From a technical perspective, the correction was expected to end around 1,400ish, which would have been 50 percent retracement from 1,100-ish. The market even respected the support level of 1,400-ish on March 5. But the growing panic in global markets also spread into the hearts and minds of Nepali investors and traders. This was immediately reflected in the multiple circuit breakers on March 10 and continued decline in the index. The confidence level of investors and traders has hit a low and this is reflected in the declining volume of trading.
NIBL extension counter at Duwakot
Nepal Investment Bank Limited has expanded its operations in Bagmati Province with the establishment of an additional extension counter at Duwakot, Changunarayan Municipality. The new extension counter in Ward No. 3 Duwakot is surrounded by Bhaktapur Municipality to south and Madhyapur Thimi Municipality to the west. Located around 20 km from the center of Kathmandu, Duwakot will run as a full-fledged extension counter to cater to the local demand.
It is NIBL’s 17th extension counter, started with the intent of aiding financial accessibility of its customers and widening financial literacy. NIBL has been catering to its customers from 82 branches, 124 ATMs, 17 extension counters, 10 revenue collection counters and 56 branchless banking counters.
OPPO launches F15 in Nepal
OPPO has come out with its latest handset OPPO F15 through its first ever online launch event in Nepal. Featuring a 48MP Ultra-Wide Angle Macro Quadcam and super sleek design, OPPO F15 offers a refreshing professional photography experience in the palm of your hands.
F Series is designed to help the young generation chase better visual expression and strive for quality, trendiness and a better life, and has won great customer love. The launch of OPPO F15 marks a new era for the series, following its continuous technological advancements based on market needs.
Priced at Rs 39,990, OPPO F15 will go on sale from Marc 23 in two stunning colors: Lightning Black and Unicorn White.

Reasons behind Nepal's recent market gyrations
NEPSE’s move towards 1,350 had created a positive vibe in the market. As soon as it reached 1,350, the public’s positive sentiments could be felt, with the average daily transaction volume reaching one and half billion rupees. From mid-February, banking sub-index also joined the party. The market turned ecstatic. No one wants to be left behind; everyone wants a piece of cake. More and more money poured in. Greater public participation could be seen at each and every broker house. Each day a record was made. The daily transaction volume reached above four and half billion rupees. Within two weeks, the index moved unchallenged close to 1,670-ish, adding 320 points. Greed took over common sense. And, on March 2 the inevitable happened: a massive correction of almost 100 points within a day resulting in negative circuit.
Until a month back, the market was abuzz with talk of liquidity crunch and its negative effects in the secondary market. But the way money has been pouring in
for the past few weeks portrays a completely different picture. The question is: have bank rates gone down significantly, has there been a fundamental shift in profitability of the companies traded in the secondary market, or have people come to their senses and dug up their hidden treasures to invest? The answer to all of
these is ‘NO’.
By the time the market moved up to 1350-ish, regular trade itself was worth one billion plus rupees each day. Natural market growth got prudent investors to either not renew their term deposits or to at least invest a portion of their term deposits back into the market. Recent government regulations made it challenging for the banking sector to lend. The changing secondary market scenario gave them impetus to move towards the upper limits in margin lending. Trading limit being provided by the broker houses also motivated regular traders to increase their trade volume. These factors set a strong foundation for the market to attract more people. The positive change in the scrip rates brought in new generation of investors/traders. With each passing day, it became evident that the market might have passed its bearish phase. This gave confidence to earlier generations of investors/traders who could now spread their investing wings.
They say, money attracts money. The closure of Nepal-China border has left the traders of Chinese goods with few options to make their money work. The slowdown in construction has also forced those in real estate to look for alternatives to hedge against the declining value of their money. Positive vibe in the market lured in this segment of the population. As with every bull run, increasing scrip rates brought in greater public participation. This further fueled market movement. The current correction phase is providing smart investors/traders an opportunity to review their strategies and realign their positions accordingly.

The battle rages on
An Increase in the deposit rates had to reflect the impact on the lending rates. This was naturally seen from late 2016, when the lending rates continued to grow in the same proportion as the deposit rates. This adversely hit the productive sector. New investments, expansions and working capital—everything became dearer. The sector, through the apex business membership organizations, including FNCCI, CNI and the relevant sectoral associations lobbied with the Ministry of Finance and the central bank to introduce measures to mitigate the situation. The central bank issued repo time and again, but this hardly addressed the long-term liquidity needs of financial institutions. The battle for deposits raged on. The understanding between the commercial banks to put a ceiling on the deposit rates provided some respite to the competing financial institutions and the debtors. Still, the voracious need of new funds to manage the gap between the demand and supply forced financial institutions to issue multi-year debentures with an average 10-plus percent return. This partially addressed long-term credit needs, primarily in infrastructure. But it did not bring down the base rate and cost of capital. The recent NRB directives put a sudden halt in financial institutions’ aggressive lending capacity.
This in turn eased the mandatory need of keeping credit to core capital plus deposit ratio (CCD ratio) at 80 percent and below. CCD ratio below 80 percent means the financial institution is in a comfortable position to extend money and is not desperate to collect deposits. The situation is assessed by the market as an early indication of bank rates cooling down in near future. While it usually takes a minimum of one fiscal for any change in interest rates to be reflected in the macro economy, the secondary market’s response is immediate. As is reflected in the chart, the increment in bank rates played role in the market direction taking a southbound dive from late- 2016. The expected decline in bank rate is already reflected in the chart from December 2019.
The second quarter-end of the current fiscal brought more answers. Net profit has increased by 10.77 percent, which is below average growth in previous years and this might not be palatable to the market. Till the end of the second quarter, the industry average of distributable profit is in the red zone and earnings per share is stagnant, meaning the commercial banks have a tougher road ahead in the next two quarters. The positive signs are a slight decline in base rate, cost of fund and CCD ratio. This mixed result provides some hope for better liquidity while still not motivating institutional investors to aggressively enter the market.
As the banking and financial institutions are the backbone of the Nepali bourse and its financial reports are transparent and published on a regular basis, institutional investors feel comfortable with their traditional choice of long-term entries. As mentioned in previous issues, as long as the BFI sector does not show a steady rise in the trading floor, the current euphoria might not have enough fuel to last long

Bank rates versus capital market
It was the middle of 2016, and the Nepali capital market was entering an all-time high territory. People were excited with the extreme bullish sentiment. But then the banking and financial institutions (BFIs) started showing some minute cracks in their spotless performance. The interbank rate (i.e. the interest rate charged on short term lending done between the banks and financial institutions) started showing queasiness. Since the start of 2012, the interbank rate managed to stay between 0.15 percent on the lower side and 1.59 percent on the higher side, with exceptions only in one or two months. The rate was still hovering at 0.69 percent in July 2016—the same month when the index reached the all-time high of 1,888. The next month in August, it climbed to 0.82 percent and, in September, leaped to 2.56 percent. This was early indication of financial institutions running short of cash. The central bank— Nepal Rastra Bank (NRB)— tried to assure stakeholders that it was a temporary phenomenon. Unfortunately, the interbank rate continued to rise, reaching 4.13 percent within February 2017. This was only the start.
As per the central bank’s directive, the BFIs had raised their capital base multi-fold, potentially diluting their earning per share. To avoid such an unpleasant situation, they were forced to go on an aggressive credit expansion. But the deposit base did not support this. Demand continued to rise while there was a short supply of cash resources. Government track record of slow capital expenditure was not much help. The pressure to perform from the shareholders forced BFI managements to look for next best solution—attracting deposits.
Cash-strapped financial institutions went on an aggressive drive to acquire new deposits and to retain the existing ones. The BFIs came up with new products providing higher interest rates. But this still did not help. Instead of attracting money from informal sector, it largely sent money from one financial institution to the next. The result was that the BFIs continued to raise deposit rates till they had an understanding to put a ceiling on it. The weighted average deposit rate of 3.28 percent in July 2016 reached 6.15 percent by July 2017. This did not show any sign of respite till July 2019, when it stood at 6.60 percent.
This worked as a double-edged sword for the NEPSE. People felt it more lucrative and safer to put their money in bank deposits than hold on with their scrips in the market. A significant segment of investors withdrew from the market to safeguard their wealth in the form of term deposits. Potential investors who were thinking of entering the market put a halt to their decision and diverted money into term deposits.
At the same time, the traders who were enjoying credit line from banking institutions found it dearer to trade. The lending rates went high, and the declining market called for aggressive margin calls from the BFIs.
This year, the government’s 2019/20 fiscal policy accompanied by the directives from the central bank has put many constraints on BFIs’ lending capacity. This development makes the BFIs less aggressive while looking for new deposits. The deposit rates are in single digit and hopefully it will stay the same. Second quarter reports of the BFIs and the review of the monitory policy will help chart new directions. Interestingly, this situation is already reflected in the capital market as it declined to sink further and has been in an upward rally from 1,100 points. The rally is waiting for the confirmation of better performance reports from the banking sector O

When facts belie figures
The media has been abuzz with the talk of Nepal’s favourable trade balance. The year-end trade statistics show a positive growth in export and a pause in import. While the export volume (in rupees) grew by 11.2 percent between the fiscal 2073/74 and 2074/75, it grew by amazing 19.4 percent between 2074/75 and 2075/76. Between 2074/75 and 2075/76, there has been a halt in ever increasing import volume too as it grew by 13.9 percent compared to 26.3 percent in the previous fiscal. Nepal has been suffering from continued import growth and declining export volume and options, draining foreign exchange reserves and widening trade deficit. The favourable figures, both in export and import, led to the slowing down of trade deficit. The reported figures portray a picture of better days in the offing.
Unfortunately, as one digs deep into export figures, the euphoria evaporates. Surge in export is neither due to increasing export volume of traditional export items like hand-knotted woollen carpet, pashmina products, handicraft, and readymade garments; nor due to any new home-grown product. The list of major export commodities shows palm oil as the number one export item for the fiscal 2075/76. Its contribution to total export, standing at 10.64 percent, was the highest among the major exported commodities. Interestingly, the export figure of palm oil was absolute ‘zero’ just a year back in 2074/75. In the first five months of the current fiscal, the trend continued. Export increased by 27 percent compared to first five months of the previous fiscal. Again, the number one contribution came from palm oil, whose export increased by 756.1 percent, reaching rupees Rs 11.52 billion in the first five months.
These figures are pleasant surprise for a nation which does not produce palm oil. Now, as one digs further into the facts, we see adoption of the ‘true and tested’ trading practice of benefiting from the tariff gap in India. This time, it is a duty of 40 percent or more imposed (by India) on import of crude and refined palm oil from major palm oil producer Malaysia. And, Nepal has 10 percent duty on import of crude palm oil. Nepal and India both being part of SAFTA (South Asian Free Trade Area), Nepali traders are more than happy to take advantage of the SAFTA’s provision of minimum tariff on goods exported from underdeveloped countries like Nepal. If the exporter can add value in final product, say by 30 percent in Nepal, then there is zero tariff levied in India. This further motivates traders to import crude palm oil, process and package it in Nepal, and export to India. But one cannot benefit from such tariff gaps for long.
Already, India’s recent move to halt the import of refined palm oil (originating in Malaysia) has hit the Nepali palm oil exporters hard. Still, there is hope if Nepali government is serious about taking this issue up with India and India agrees to halt in import of products originating only in Malaysia. Nepal has been importing crude palm oil from both Malaysia and Indonesia. If so, Nepal might need to shift all its crude palm oil import to Indonesia and ensure there is at least 30 percent value addition while producing refined palm oil in order for Nepal to continue to benefit from its export of palm oil.
Note: All facts and figures are derived from online resources of Trade and Export Promotion Centre, Ministry of Industry, Commerce and Supplies
Banking subindex: Half full or half empty?
In the past six weeks, NEPSE has shown some positive signs. The index was unwilling to sink below 1,110 and instead moved north from 25 November 2019. Now, it is experiencing a tough call at 1,170, while still managing to stay above 1,150. The positive rally is mainly supported by the non-banking scrips. As discussed in my last column, the Nepali bourse is dominated mainly by the banking and financial institutions-related sub-indices. Only if the banking sub-index wakes up from its protracted bearish nightmare will the current positive rally test further highs.
Since mid-September, the banking sub-index is moving in a ranged zone with a narrow gap of just 50 points. Its movement is restricted within 1,010 points, working as the support, and 1,060 points, working as the resistance. Its inability to break the resistance at 1,060 paints a bleak picture for the bourse’s northbound movement. Still, its unwillingness to go below 1,010 points gives an optimistic view of the sub-index already testing its troughs. As long as this non-trending situation continues in the banking sub-index, the overall market will not get a clear direction.
On 23 July 2015, the new Governor of Nepal Rastra Bank Chiranjibi Nepal unveiled his first monetary policy—announcing 300 percent increment in the minimum paid-up capital requirement for commercial banks. The same policy asked the development banks to raise their paid-up capital by 2,300 percent. The new policy required the commercial banks to raise their paid-up capital from Rs 2 billion to Rs 8 billion. National-level development banks needed to raise it from Rs 640 million to Rs 2.5 billion. They were given two years to achieve this target. The underlying objective was to encourage them to go for mergers and acquisitions and reduce the number of commercial and development banks.
But as the majority of commercial banks were not in favor of mergers and acquisitions, only a few went for it. The majority decided to utilize the two years’ time to raise paid-up capital by issuing bonus and right shares. Promising net earnings of commercial banks coupled with the certainty of multiplication in the shareholdings encouraged people to invest in such scrip. The demand exceeded the supply and the banking sub-index saw continued higher-highs in its trading charts.
The dominance of the banking sub-index swayed the bourse in favorable territory and NEPSE saw a bullish run till August 2016. While the expectations of future return fuelled the Bull Run, the actual realization of the return in bonus and right issuance resulted in a glut in the market. Existing demand was unable to absorb the ever-increasing supply. In addition, the increasing supply started diluting the earnings. The blue-chip scrip of Standard Chartered Bank alone saw a decline in earnings per share from Rs 67.47 in Fiscal Year 2070/71 to Rs 31.15 in the Fiscal Year 2075/76. This is attributed to a massive increase in capital. Of course, all of these companies are working hard to maintain their previous earning levels but this requires time.
The second quarter of Fiscal Year 2076/77 is almost ending. Now, everyone is eagerly waiting to review the quarterly reports for signs of earning rebound. If the reports show better earnings compared to previous fiscal, the investors will get more bullish. Each quarter report (of different banks) showing positive growth in net income (compared to the same quarter of previous year) will fuel interest to accumulate their stock. As soon as we see this in financial reports, we can also witness breakouts at multiple resistance levels in the technical charts. In next one month, the mystery will start to unravel and people will have better information to take their positions.

Making sense of the geek talk: II
‘Earnings Per Share (EPS)’ and ‘Price-to-Earnings Ratio (P/E Ratio)’ are closely followed by ‘Price/Earnings to Growth Ratio’ or more commonly ‘PEG Ratio’. This ratio of a stock is derived when its P/E ratio is divided by the growth rate of its earnings. Growth rate is calculated through comparing the net growth in earnings this year with the total earnings of the previous year. If we can calculate the growth rates of multiple years, we could take an average of these to make more accurate predictions. A larger number of investors and analysts like to use the growth rates of at least three to five years to compute the average growth rate. Unlike in the past, we no longer need to do our own calculations meticulously and instead can use the estimated data available on online financial portals.
In the previous issue, I had said that during the bullish trend, P/E ratio of even the fundamentally weak scrip becomes high. But during the bearish trend, the P/E ratio of even stronger companies go low and lower. Low P/E ratio attracts long term investors into such scrips. But if a scrip with lower P/E ratio has negative growth, the investment will have questionable future. The remedy is to assess the PEG ratio. Lower PEG ratio shows that the stock is undervalued with respect to its estimated future earnings, while the higher PEG means the stock is overpriced in comparison to its growth potential. Generally, when the PEG ratio of a stock is higher than 1.0, it is assessed as overvalued and a stock with a PEG ratio of less than 1.0 is assessed as undervalued. PEG ratio assessment is no different to understanding that taking one too many peg will put your health at risk!
‘Return on Investment (ROI)’ measures the profitability of an investment. It calculates the estimated yield from an investment, in relation to the cost of investment. When we divide the yield (from an investment), by the cost of the investment, we determine the ROI. Positive ROI means the investment is worthwhile while negative ROI highlights the possibility of loss.
ROI is a popular tool among investors as its calculation is relatively easy. Also, it is easy to interpret and it has multiple usage. ROI is not only used in the stock market but also to assess the profitability of an investment project by both the public and private sectors.
‘Float’ in stock market means the number of shares available with the public for regular buying and selling purposes. This number is calculated by subtracting the promoter’s share, government owned share and the share under lock-in period—shares issued to the affected local public of the project site and shares issued to the employees of the company can be traded after a minimum three years—from the total shares outstanding. Float provides a picture of real supply situation of a particular stock. Lower float means less supply for regular trading and this at times leads to artificial demand, leading to unnatural price fluctuation. When one does not have an understanding of the float, there is a chance of him/her falling into buying trap.


